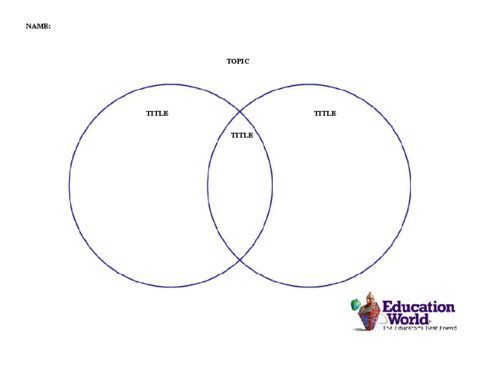
Remember them? Venn diagrams are still an effective way to compare and contrast information. The two overlapping circles you create set up 3 areas to record your information. For example, think of apples and oranges.
Use the far left section of the circle to represent distinct apple characteristics, the far right to represent distinct orange characteristics and the overlap to represent their similarities:
Apples distinct characteristics (left side outside the overlapping circles) include: shape, color , taste, where they grow, uses in recipes, flavor
Oranges distinct characteristics (right side outside the overlapping circles) include: shape, color, taste, where they grow, uses in recipes, flavor
The two interconnect in the overlapping circle sections because both: are fruit, grow on trees, have skins.
Venn diagrams can be used to compare almost anything: story characters, geographic features, historic events, artists, etc. After the obvious traits are listed, they call upon the students to dig deep and find creative ways the two chosen items are similar and different. They can be used with every age group and can move comparing from important ideas to sharing creative thinking. After all, who’d think you could compare an elephant to a tree and fill-in a Venn diagram?
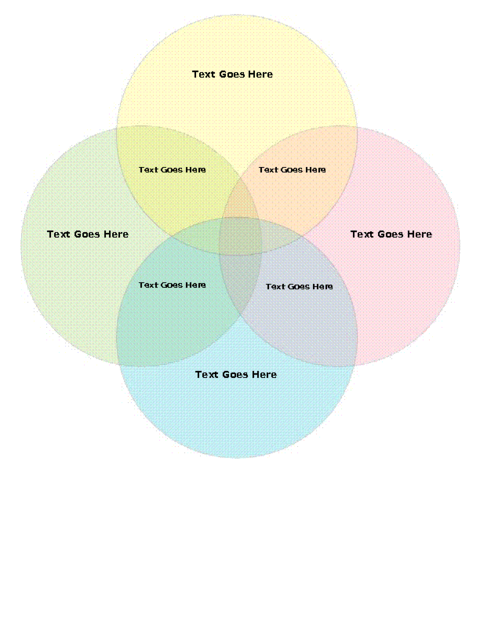
Consider getting more complex. Use 3 or 4 interconnected circles. Enjoy!